I received an email from a PediTools user that led me to think about what it means to be a clinician who also codes and enjoys data science. I really think that more clinician data scientists are needed to translate the hugely increasing amount of clinical data available into better clinical care.
With their permission, I’d like to respond to an excerpt of their email.
I am a big fan of your work … Please post more walkthroughs of how you accomplish some of your projects so that I can shamelessly copy you. … It is rare to find physicians that are actually great at R. I did this [Shiny App] in fellowship … but it took me sooooooo long. And it was … not novel. Just some videos on how you use R Markdown for clinical applications. How you maintain a highly used website. … It’s a niche but I’m a fan.
First things first – I am not a “great” coder
While I have enough experience coding to be able to appreciate elegantly written code and can write code that does things correctly, I’m not a particularly skilled coder. I’ll write something that gets the job done but hate how I did it. If it’s bad enough, or if I think I’ll need to maintain it, I’ll easily spend more time refactoring it to be less terrible than I spent writing the functional code in the first place.
Things that have helped me most coding:
Know how to find solutions
There are so many things I don’t know how to do, but I’m pretty good at finding solutions. Resources I use all the time:
- Stack Overflow
- Stack Exchange
- RStudio community
- And of course… Google
- (I’m just starting to learn Quarto now – Quarto dev has been great.)
There are so many helpful people in these communities who are willing to help. That being said, it’s incredibly important to be able to ask questions well. Have a clear reproducible example that shows exactly what the problem is. The reprex R package is helpful for posting good questions about R.
There are also some really, really great resources for learning out there that are often free.
- R for Data Science – the absolute bible of doing data science in R, featuring the
tidyverse - Introduction to Statistical Learning – an excellent introduction to learning from data (i.e., machine learning), using R for examples
What to code – novelty and “copying”
There’s nothing wrong with not being novel and nothing wrong with copying ideas. The important thing for me has always been to do something useful or better.
Why does PediTools even exist? Because on one Sunday afternoon in the NICU, a very large for gestational age baby was admitted with hypoglycemia. The resident’s admission note made no mention of the LGA status because it was too much of a hassle to manually plot it on a paper growth chart (this was before we had an integrated EHR). I thought there had to be a better way. PubMed led to an article about parameterization of the growth chart we used at the time, which led, after a number of false starts, to PediTools.
The point is that I felt there was a need for a better way to do something, found that it didn’t exist but could exist, and beat my head against it until it did.
Pregnancy wheels exist. But I thought they could be better for use by neonatologists who need more than just an LMP and EDC, and would might also want PMA, chronologic age, date of birth, or date of interest. Oh, and sometimes they have X and want Y, but sometimes it’s the other way around – inputs and outputs should be switchable. So that led to this gestational age calculator tool. The code isn’t particularly elegant, but what I like about it is that you can enter whatever information you have, and the tool will iteratively try to calculate everything else it can.
Tools to assist with management of hyperbilirubinemia have existed from just after the AAP 2004 guidelines were released – BiliTool came out in 2004 I think. But, BiliTool didn’t do some things that I wanted it to do, so I wrote my own version which did those things. And I like my tool better. But, that’s where novelty may be more important. My tool came out in 2014, a decade later. And even though I think my tool is better and prefer to use it myself, it gets only a tiny amount of traffic (although there are clinicians I’ve spoken with who tell me they switched to my tool, I bet it’s pretty rare). People use what they’re used to and trust.
So, if you come out with something that there’s already an existing tool for, even if yours is “better,” don’t expect practice to change. If you’ve ever done practice change / quality improvement work in the clinical environment, you probably know how hard it is to get people to adopt new practices.
Use the right tool
You might like R. I really like R for data exploration, analysis, and visualization, but it might not be the right tool for whatever process you’re trying to improve.
For the Fenton growth chart parameterizations… I’ve coded those calculations in so many different ways… First was probably an Excel spreadsheet. Then in Microsoft Visual Basic. Then in Perl (what was I thinking?!? My excuse – I didn’t learn R till years later) for multi-hospital data analysis. But those weren’t easily sharable to others. So I looked at multi-platform standalone application development (for both iOS and Android) and tried to learn… Lua? Didn’t get far. Figured that a web-based tool would be easier and more accessible, so learned PHP, which eventually led to the PediTools web site. Some time later, I learned R, and realized that having a separate PHP script for each and every growth chart was really difficult to maintain, so wrote an R package that handles all growth charts, and a Shiny App that uses it. And now… I’m realizing that maybe PHP is getting a bit archaic for web pages, so… should I learn ReactJS for the front end and have it hit an R-powered API endpoint for the backend? I don’t know. Thinking about it.
There are many tools, and although it takes time to learn new ones, if you find it fun to learn new tools, it gives you more flexibility.
And yeah, Shiny is hard. Really hard. Ugh. I hate developing in Shiny.
Speaking of tools, RMarkdown is awesome but Quarto will probably be even better
I’m not sure why the person who emailed me alluded to “R Markdown for clinical applications” – I wasn’t aware that I had done anything publicly in that sector.
But there’s so much you can do with R Markdown and related packages. Something I do that hasn’t been reported publicly is semi-automated clinical dashboard generation. I’ve generated and distributed dashboards monthly for:
- Morbidity and mortality conference
- Newborn readmissions
- Unintended extubations
- Hearing screen referral follow-up
- Admission temperatures
- Time to first enteral feed
- Documentation of dosing weights
- Antibiotic utilization
- Hepatitis B vaccination
The workflow is done nearly entirely in R and R Markdown, from SQL query (RODBC) of Epic EHR data, to tidyverse to pre-process the data, analyze it, and generate plots (ggplot2), including QI SPC charts, to flexdashboard interactive dashboard generation in HTML, to email distribution.
The workflow is very fragile and fails a lot, but it’s pretty cool.
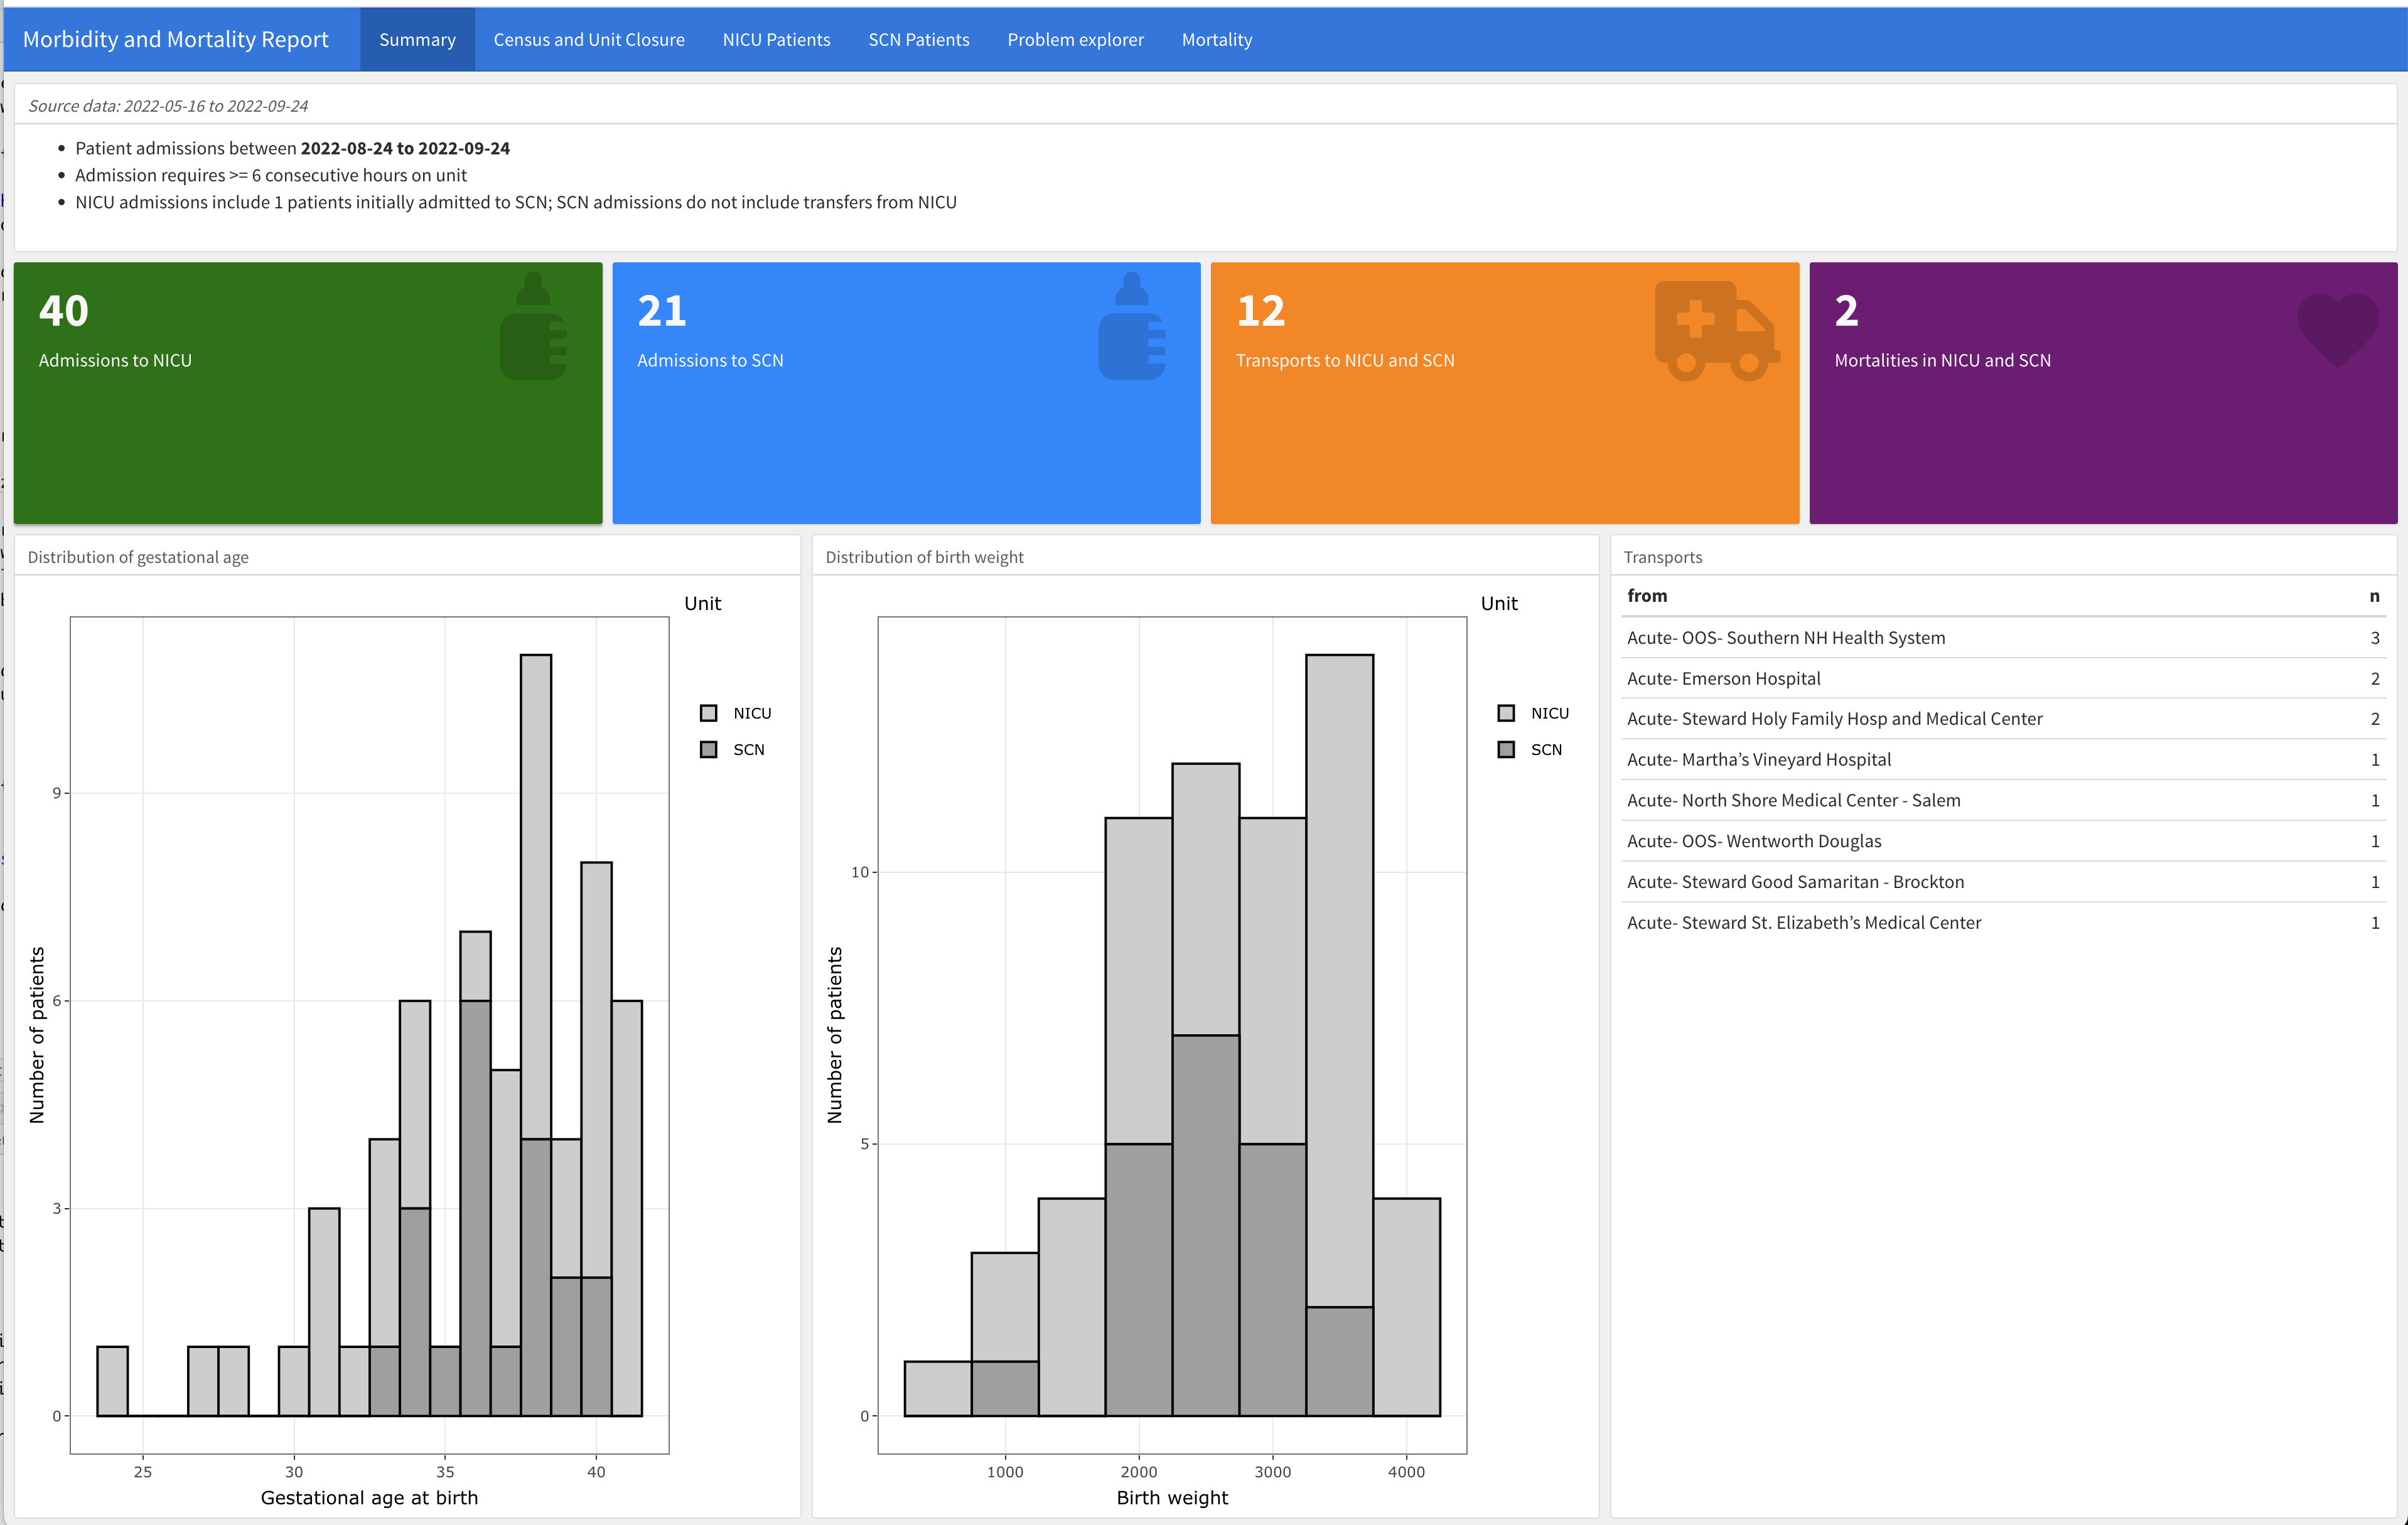
An example is the first page of the M&M report, which shows some overall numbers and demographics. Not shown are the other tabs: the second tab shows unit census and closure information, and additional tabs include the specific patients and their info + problem lists.
I don’t publish much, but my two most recent manuscripts were created exclusively in R Markdown, with the analysis and figure generation done within the R Markdown itself. Citations were also automatically handled (with Zotero).
Blogs can be done in blogdown, but I found the interaction of R / blogdown and Hugo and netlify to be very fragile and not fun at all. But then… Quarto, which sounds like it will do it ALL.
Even though I’ve only used it for just over a month, Quarto looks like it will be so much better than the current fragmented R Markdown-based tools and packages. As soon as a flexdashboard equivalent is released for Quarto, I’ll probably migrate completely over. Integrating multiple tools under ONE application, that’s language agnostic, with consistent syntax. This is great and will only get better.
Code a lot
The more you code, the more fluent you get, and the more you can get done, easily.
R is great for data science, but you need data. Once you get it, practice R / tidyverse on it.
If you’re a neonatologist, get access to your institution’s Vermont Oxford Network registry raw data (exported as JSON, or XML, or CSV), read it into R, and do stuff with it.
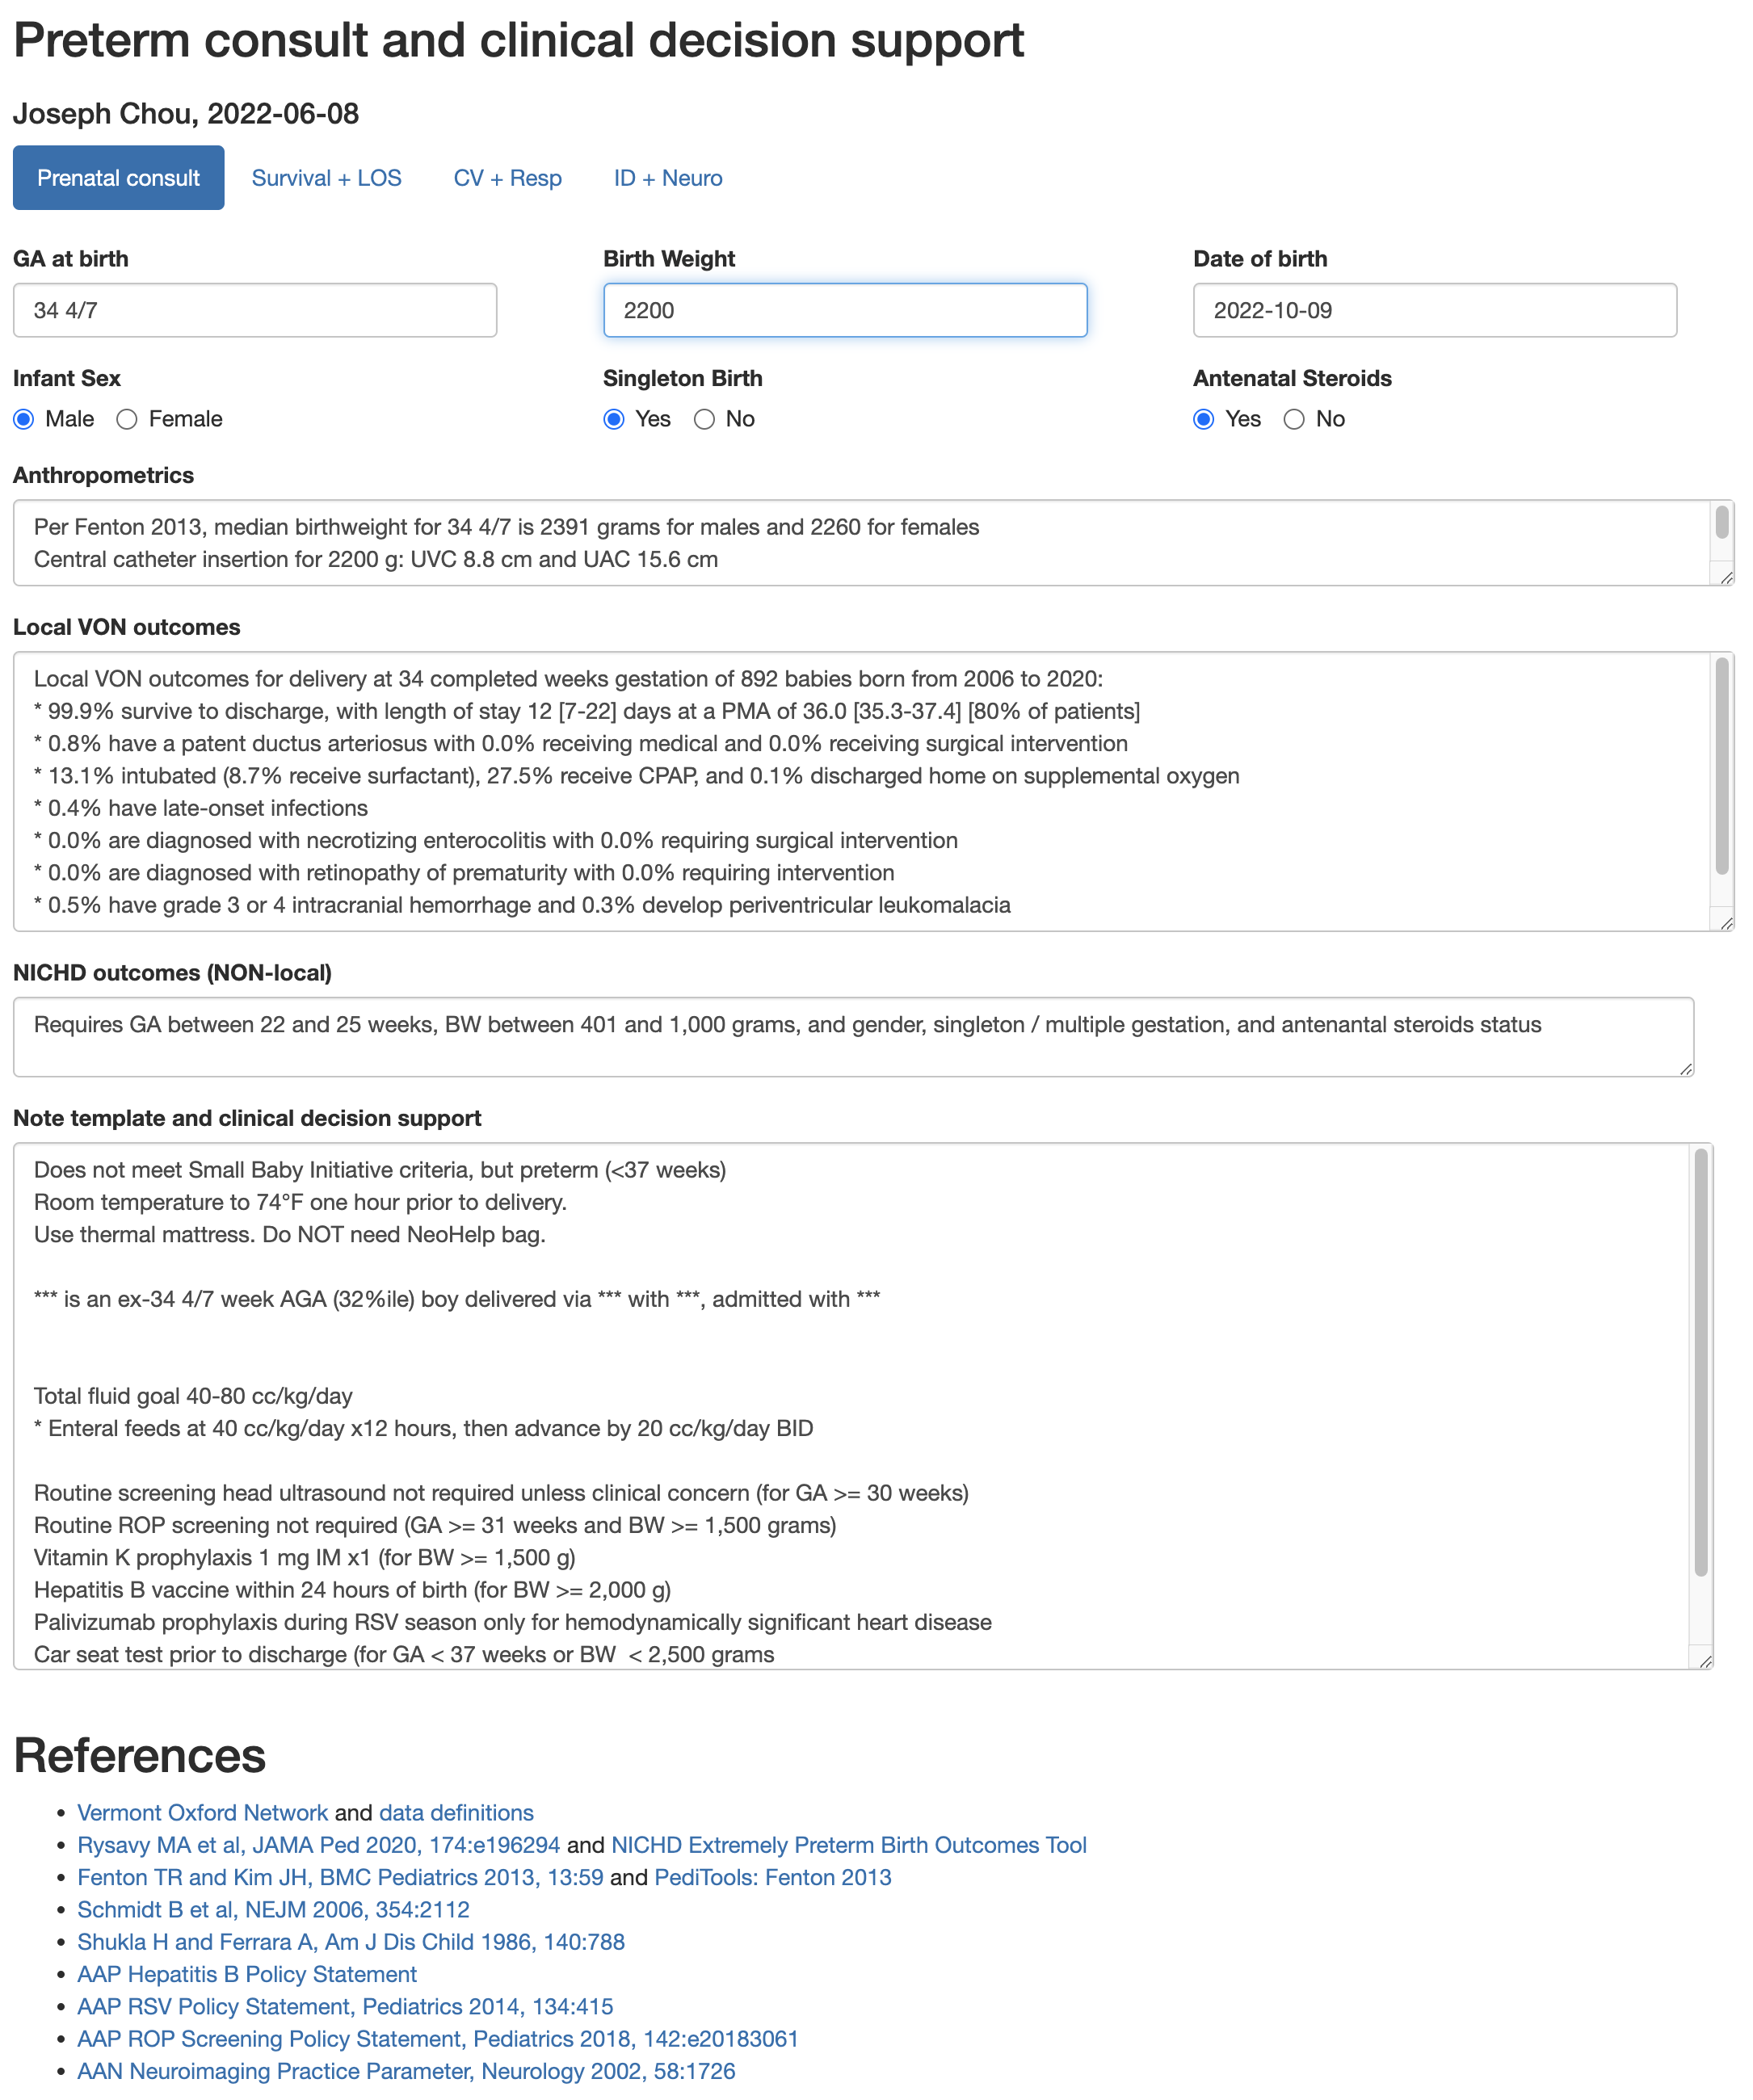
I wrote a Shiny App to help with preterm consults – it reads a VON dataset, summarizes outcomes by completed weeks of gestation at birth, and reports it. Combined with some simple conditionals of local practice guidelines, it becomes a handy clinical decision support tool that reports expected outcomes (and interquartile ranges) too (e.g., length of stay, postmenstrual age at discharge, incidence of intubation / CPAP / common morbidities, etc.). It also calculates growth metrics (Fenton 2013) and re-creates the NICHD outcomes calculations (only for extremely preterm).
If you’re very very lucky (or persistent), get access to the raw EHR data and learn how to work with the data. I’m still learning how to do this (EHR data is so very, very terribly messy, but so rich in information…) And with this volume of data, you can start to do clinical machine learning, like NLP on maternal pregnancy episode clinical notes to predict risk for neonatal abstinence syndrome or predicting neonatal bilirubin trajectories.
But I’ve also learned that if I don’t keep on finding little projects to work on and code, I lose the skills.
I started learning the Julia programming language in December 2021, and for the next 2 or 3 months, did two years of Advent of Code puzzles for fun. By the end of that time, I felt like I was starting to get a pretty good grasp of Julia. And then I set it aside for 8 months. And last week, I needed to do something in Julia and couldn’t even remember how to how to start up Julia in VS Code. Well, it’s almost December and another year of Advent of Code, so I guess I’ll start over again and re-learn it all.
Nobody will read this
But that’s OK. I wanted to think about and reflect on what I’ve learned over the years as a self-taught “clinical data scientist” with no formal training. One step at a time, one new tool at a time, one project or puzzle at a time, I think I’ve gotten a lot of useful things done. And I think I’ve helped a lot of babies and kids get better clinical care.
That’s good enough.
But I wish there were more clinical data scientists out there. It gets lonely.
Footnotes
Photo by Luke Chesser on Unsplash↩︎