# Monte Carlo simulation of RISK battles to determine distribution of outcomes

library(tidyverse)

##### Simulate outcome of one battle ####
simulate <- function(attackers, defenders) {
  # returns vector of remaining c(attackers, defenders)

  # 'probs' is dataframe of probabilities of all outcomes of attackers versus defenders
  # - 3 vs 2, 3 vs 1, 2 vs 2, 2 vs 1, 1 vs 2, 1 vs 1
  probs <- structure(   # reload probs from dput(probs)
    list(
      att = c(3, 3, 3, 3, 3, 2, 2, 2, 2, 2, 1, 1, 1, 1),
      def = c(2, 2, 2, 1, 1, 2, 2, 2, 1, 1, 2, 2, 1, 1),
      def_lose = c(0, 1, 2, 0, 1, 0, 1, 2, 0, 1, 0, 1, 0, 1),
      att_lose = c(2, 1, 0, 1, 0, 2, 1, 0, 1, 0, 1, 0, 1, 0),
      n = c(2275, 2611, 2890, 441, 855, 581, 420, 295, 91, 125, 161, 55, 21, 15),
      p = c(0.292566872427984, 0.335776748971193, 0.371656378600823, 0.340277777777778,
            0.659722222222222, 0.448302469135802, 0.324074074074074, 0.227623456790123,
            0.421296296296296, 0.578703703703704, 0.74537037037037, 0.25462962962963,
            0.583333333333333, 0.416666666666667)),
      class = c("tbl_df", "tbl", "data.frame"), row.names = c(NA, -14L)
    )

  ##### 3 attackers / 2 defenders #####
  while (attackers > 3 && defenders > 1) {
    num_sim <- min(
      as.integer((attackers - 2)/2), # max number of times attacker could attack with 3 and lose 2
      as.integer(defenders/2)
      )
    result <- probs %>%
      filter(att == 3, def == 2) %>%
      sample_n(size = num_sim, replace = TRUE, weight = p) %>%
      summarise(def_lose = sum(def_lose), att_lose = sum(att_lose))
    attackers <- attackers - result$att_lose
    defenders <- defenders - result$def_lose
  }

  ##### if still can attack #####
  while (attackers > 1 && defenders > 0) {
    num_att <- ifelse(attackers > 3, 3, attackers - 1) # number of dice attacker can roll
    num_def <- ifelse(defenders > 1, 2, 1) # number of dice defender can roll
    result <- probs %>%
      filter(att == num_att, def == num_def) %>%
      sample_n(size = 1, weight = p)
    attackers <- attackers - result$att_lose
    defenders <- defenders - result$def_lose
  }
  return(list(attackers = attackers, defenders = defenders, net = attackers - defenders))
}Playing RISK recently, I was annoyed when I lost a battle despite overwhelming numbers. “What are the odds of that?!?” Which led me to write this simulation to figure it out.
My first approach was to simulate each and every die roll, but that turned out to be slow. Given that there are a pretty limited number of die roll options, I decided to exhaustively enumerate all possible scenarios and the resultant probabilities of outcomes. Saving that table in a dataframe, you could them sample from that dataframe, using the outcome probabilities as sampling weights.
Generating that table of probabilities was harder than I thought, and in the end, the code to generate the table was embarrasingly inelegant. But it worked. It’s included at the bottom, where I don’t have to look at how horrible it is.
Below is the code to run the simulation and display outcomes.
And yes, I was terribly unlucky to have lost that battle.
Code for the functions
simulate()
- simulates the outcome of a single battle between two territories, until either the defender is defeated, or the attacker has been reduced to 1 remaining army
simulate_multi()
- simulates the outcome of a string of battles, originating from a single attacker territory, through a number of defender territories
- each time the attacker wins, one attacker must remain in a defeated territory
- this proceeds until either all defender territories are defeated, or the attacker has been reduced to 1 remaining army
- there’s a pretty high possibility that I have a fencepost error or inconsistency in here someplace, related to leaving an attacker behind each defeated territory, but because this is just for fun, I won’t be spending time doing confirmatory testing
##### Simulate outcome of string of battles ####
simulate_multi <- function(attackers, defenders) {
  # attackers = number of attackers available
  # defenders = vector of numbers of defenders in each successive territory
  # returns
  # - number of attackers remaining, NOT including single army left in each defeated defender territory
  # - number of defenders in each original defended territory
  # - net remaining attackers - sum(defenders)
  for (i in 1:length(defenders)) {
    if (attackers > 1) { # still able to attack
      result <- simulate(attackers, defenders[i])
      attackers <- result$attackers
      if (result$defenders == 0) { attackers <- attackers - 1 } # need to leave one attacker behind
      defenders[i] <- result$defenders
      # print(paste(attackers, '/', paste0(defenders, collapse = '-')))
    }
  }
  return(list(
    attackers = attackers,
    defenders = defenders,
    net = attackers - sum(defenders)
  ))
  }
plot_simulation()
- performs
simulate_multi()a specified number of times, and displays a plot of the outcomes with some summary statistics
##### Plot simulation -- report fraction of victories and distribution of end results #####
plot_simulation <- function(num_sim, attackers, defenders) {
  # attackers = number of attackers available
  # defenders = vector of numbers of defenders in each successive territory

  net = vector(mode = 'numeric', length = num_sim) # pregenerate empty result list
  for(i in c(1:num_sim)) {
    result <- simulate_multi(attackers, defenders)
    net[i] = result$net
  }

  df <- data.frame(net = net) %>%
    group_by(net) %>%
    summarise(n = n()) %>%
    mutate(
      percent = round(100 * n / sum(n), 2),
      label = paste0(percent, '%'),
      victory = ifelse(net <= 0, 'Lost', 'Won')
    )
  nudge = max(df$percent)/40
  percent_success = df %>% filter(net > 0) %>% summarise(percent = sum(percent)) %>% .$percent
  g <- df %>% ggplot() +
    geom_bar(aes(net, percent, fill = victory), stat = 'identity') +
    geom_text(aes(net, percent, label = label), vjust = 0, nudge_y = nudge) +
    labs(
      title = paste0("RISK simulation: attackers victorious ", percent_success, "% of time (n=", num_sim, ')'),
      subtitle = paste(attackers, "attackers", "versus", paste('[', paste(defenders, collapse = ','), ']', sep = ''), "defenders"),
      x = "Net (attackers - defenders) remaining at end",
      y = "Frequency"
    ) +
    theme_bw() +
    scale_fill_manual(values=c("darkred", "darkgreen"), name = 'End result') +
    theme(legend.position = c(0.1, 0.9))

  return(g)
}
Example output
Single territory: 10 attackers, 10 defenders
set.seed(1)
plot_simulation(num_sim = 1000, attackers = 10, defenders = 10)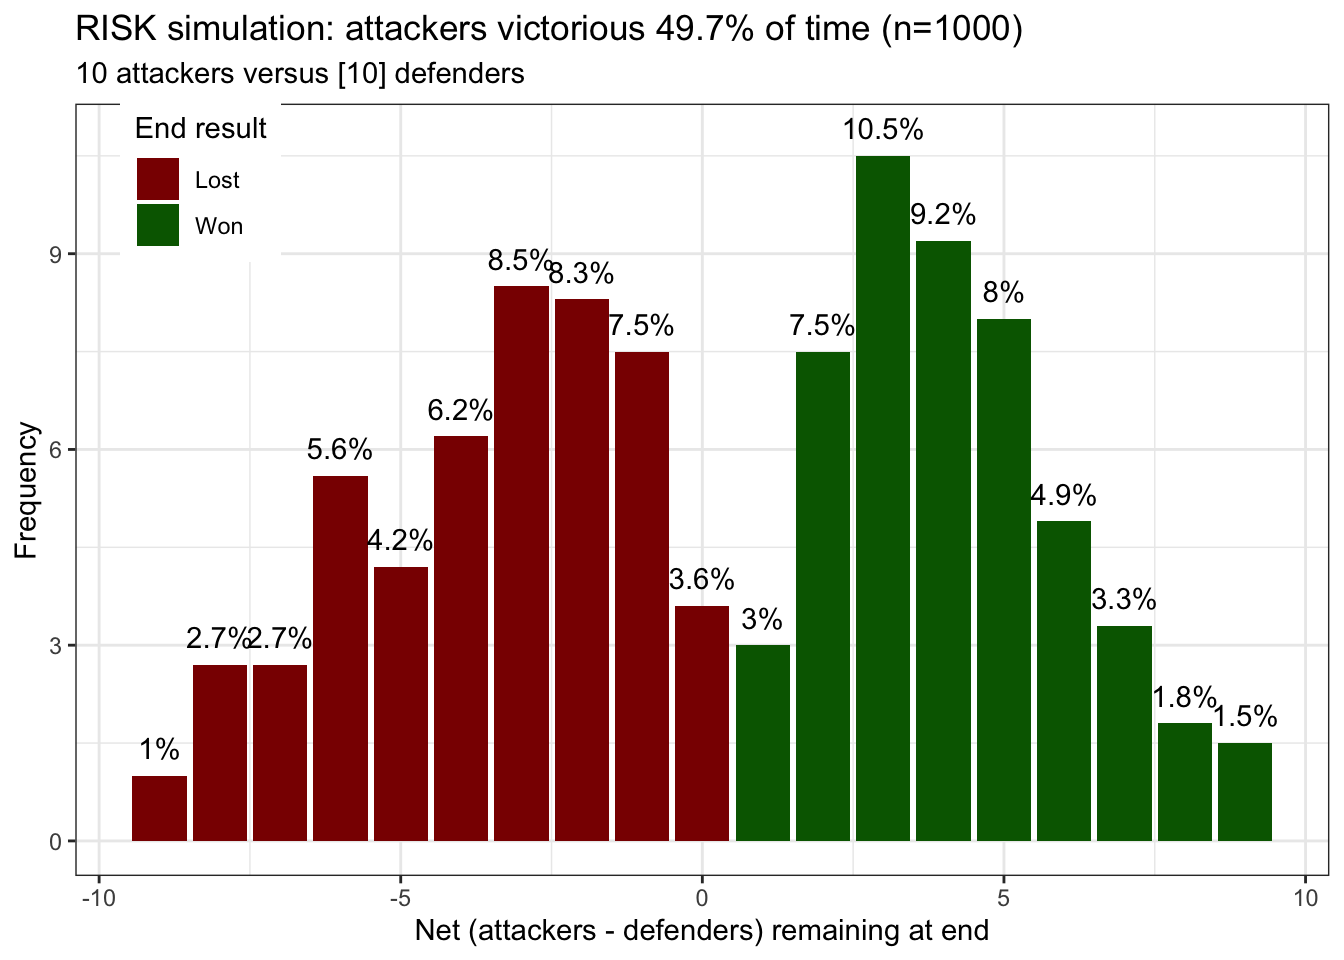
Multiple territories: 12 attackers, 3 defender territories each with 3 armies
plot_simulation(num_sim = 1000, attackers = 12, defenders = c(3,3,3))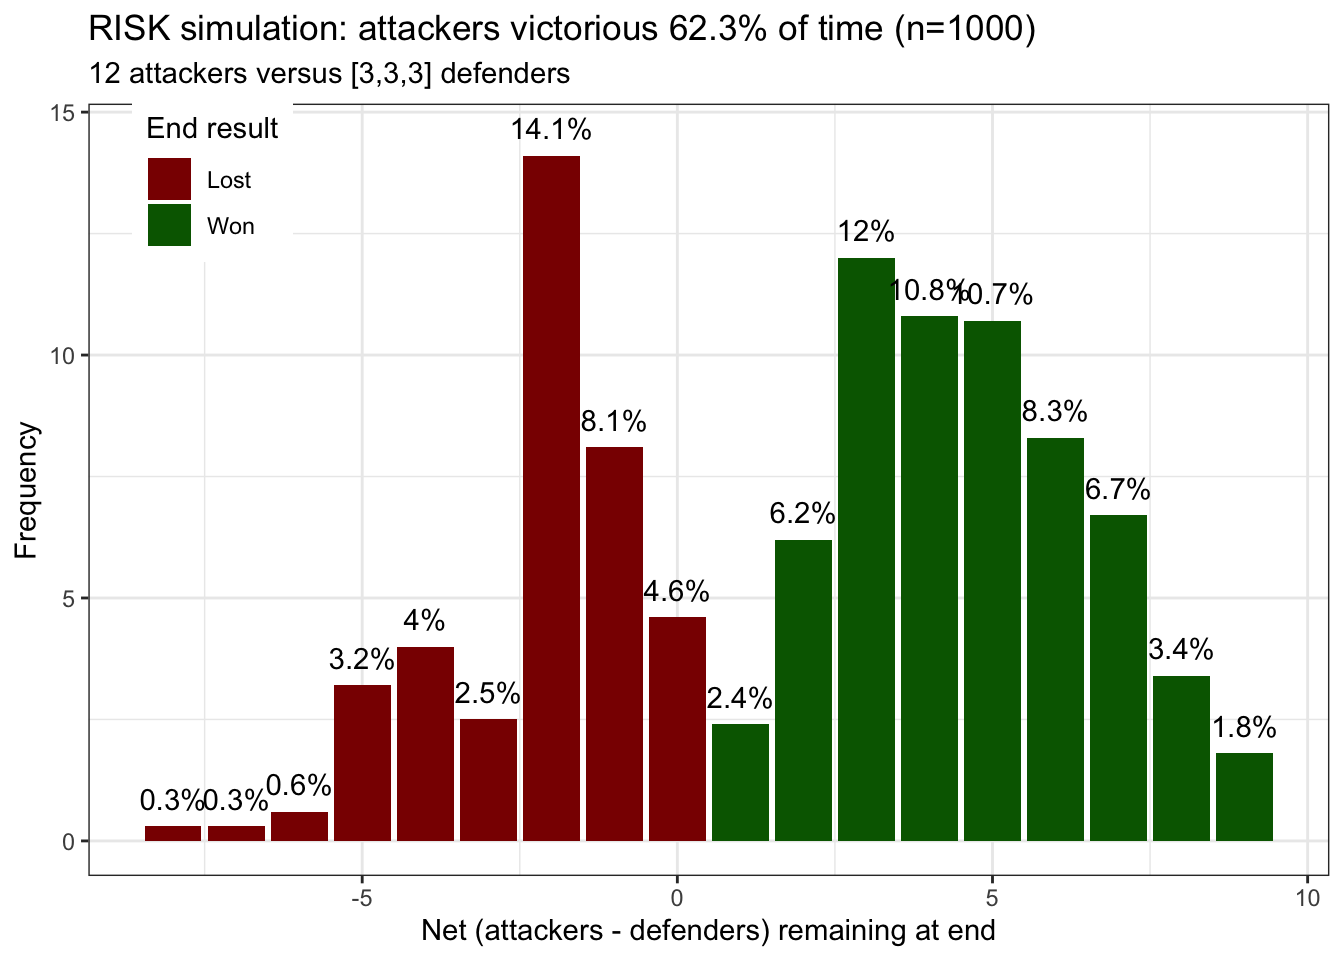
Multiple territories: 12 attackers, 8 defender territories each with 1 army
plot_simulation(num_sim = 1000, attackers = 12, defenders = c(1,1,1,1,1,1,1,1))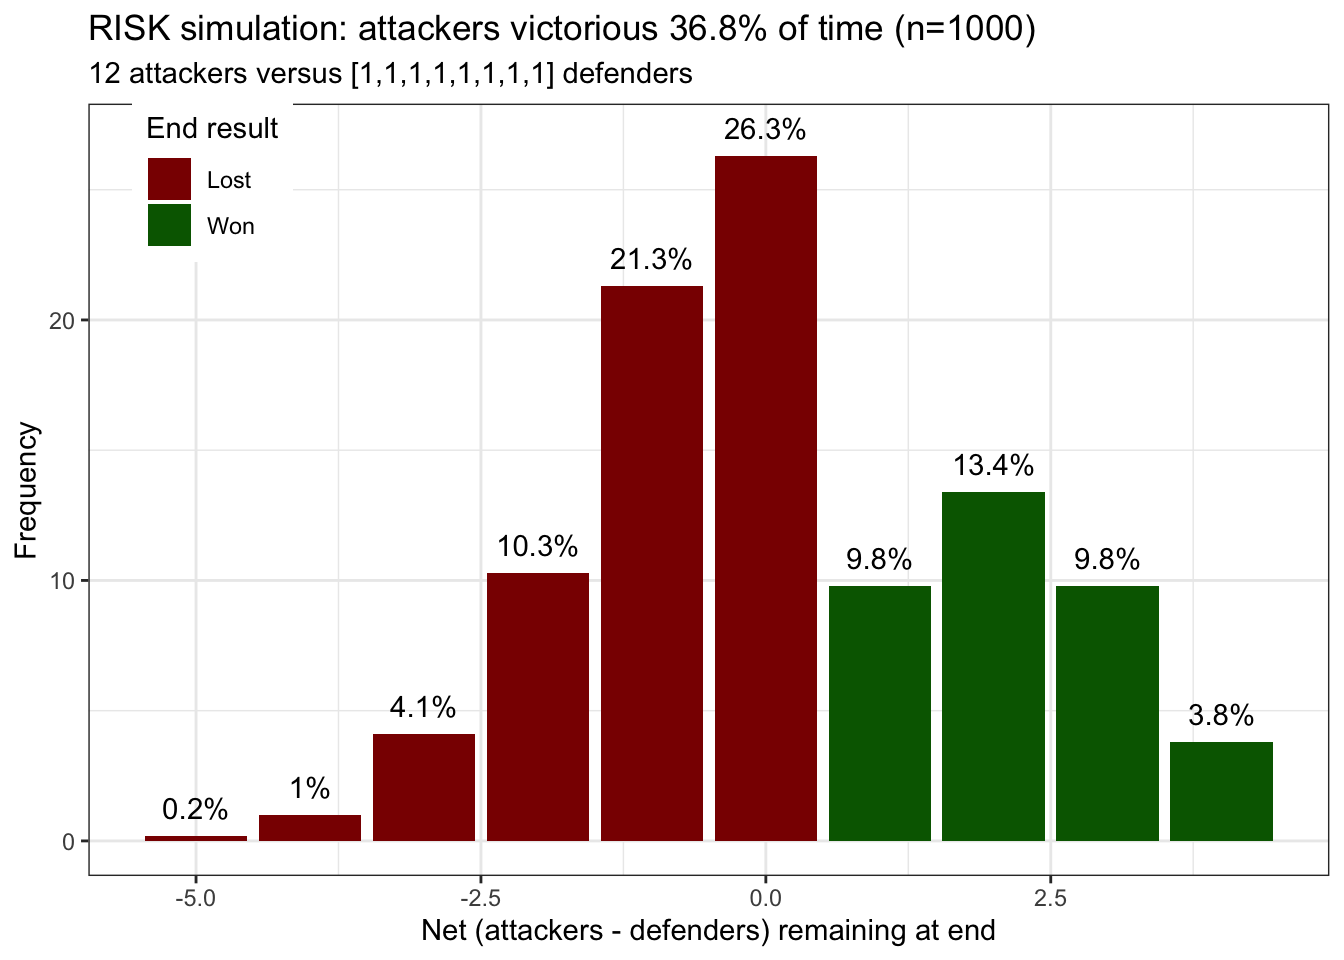
Inelegant code to build the outcome probability dataframe
##### Generate outcome probability dataframe 'probs'
#
# This code is horrible. What's done is done. Let us never speak of it again.
#
# 'probs' is dataframe of probabilities of all outcomes of attackers versus defenders
# - generated by exhaustively enumerating ALL possible die rolls for ALL possible attacker vs. defender matchups
#   and then summarizing the counts of options in a dataframe
# - can then sample from the dataframe, using the counts as weights, to determine outcomes in bulk
# - attackers versus defenders possibilities: 3 vs 2, 3 vs 1, 2 vs 2, 2 vs 1, 1 vs 2, 1 vs 1
#
# Columns:
# - att / def = number of attacker and defender die to roll
# - att_lose / def_lose = # of attackers and defenders lost
# - n / p = total number of ways / probability that this outcome can be generate, for a given att / def
#
# Usage:
# probs %>% filter(att == 3, def == 2) %>% sample_n(size = num_sim, replace = TRUE, weight = p) %>% summarise(def_lose = sum(def_lose), att_lose = sum(att_lose))
#
# Generation:
# - absolutely, embarrasingly ugly
# - spent too much time trying unsuccessfully to come up with an elegant solution
# - but with only 6 options (3 vs 2, 3 vs 1, 2 vs 2, 2 vs 1, 1 vs 2, 1 vs 1), easier to just copy/paste, brute-force it
# - so, do it ugly and inelegant, save the output of dput(probs), and just don't look at the generator code ever again


##### Individual die roll possibilities #####
a1 <- data.frame(a1 = c(1:6), dummy = 'x')
a2 <- data.frame(a2 = c(1:6), dummy = 'x')
a3 <- data.frame(a3 = c(1:6), dummy = 'x')

d1 <- data.frame(d1 = c(1:6), dummy = 'x')
d2 <- data.frame(d2 = c(1:6), dummy = 'x')

probs <- data.frame(
  att = vector(mode = 'numeric'),
  def = vector(mode = 'numeric'),
  def_lose = vector(mode = 'numeric'),
  att_lose = vector(mode = 'numeric'),
  n = vector(mode = 'numeric')
)

##### 3 attackers / 2 defenders #####
df <- list(a1, a2, a3, d1, d2) %>%
  reduce(inner_join, by = "dummy") %>% # cartesian product of all individual die rolls to dataframe
  select(-dummy) %>%
  mutate(
    # generate att / def list columns of sorted vector of rolls
    att = Map(c, a1, a2, a3),
    att = Map(sort, att, decreasing = TRUE),
    def = Map(c, d1, d2),
    def = Map(sort, def, decreasing = TRUE),
    # generate columns of highest att / def rolls
    a_1 = Map(nth, att, 1),
    a_2 = Map(nth, att, 2),
    d_1 = Map(nth, def, 1),
    d_2 = Map(nth, def, 2)
  ) %>%
  select(-a1, -a2, -a3, -d1, -d2, -att, -def) %>% # needed before unnest()
  unnest() %>% # needed because the result of Map appears to still be a
  mutate(
    def_lose = as.numeric((a_1 >  d_1) + (a_2 >  d_2)), # number of defenders lost
    att_lose = as.numeric((a_1 <= d_1) + (a_2 <= d_2))  # number of attackers lost
  ) %>%
  count(def_lose, att_lose) %>%
  mutate(att = 3, def = 2)
Warning: `cols` is now required when using unnest().
Please use `cols = c(a_1, a_2, d_1, d_2)`probs <- probs %>% bind_rows(df)
##### 3 attackers / 1 defender #####
df <- list(a1, a2, a3, d1) %>%
reduce(inner_join, by = "dummy") %>% # cartesian product of all individual die rolls to dataframe
select(-dummy) %>%
mutate(
# generate att / def list columns of sorted vector of rolls
att = Map(c, a1, a2, a3),
att = Map(sort, att, decreasing = TRUE),
def = Map(c, d1),
# generate columns of highest att / def rolls
a_1 = Map(nth, att, 1),
a_2 = Map(nth, att, 2),
d_1 = Map(nth, def, 1)
) %>%
select(-a1, -a2, -a3, -d1, -att, -def) %>% # needed before unnest()
unnest() %>% # needed because the result of Map appears to still be a
mutate(
def_lose = as.numeric((a_1 > d_1)) , # number of defenders lost
att_lose = as.numeric((a_1 <= d_1)) # number of attackers lost
) %>%
count(def_lose, att_lose) %>%
mutate(att = 3, def = 1)Warning: `cols` is now required when using unnest().
Please use `cols = c(a_1, a_2, d_1)`probs <- probs %>% bind_rows(df)
##### 2 attackers / 2 defenders #####
df <- list(a1, a2, d1, d2) %>%
reduce(inner_join, by = "dummy") %>% # cartesian product of all individual die rolls to dataframe
select(-dummy) %>%
mutate(
# generate att / def list columns of sorted vector of rolls
att = Map(c, a1, a2),
att = Map(sort, att, decreasing = TRUE),
def = Map(c, d1, d2),
def = Map(sort, def, decreasing = TRUE),
# generate columns of highest att / def rolls
a_1 = Map(nth, att, 1),
a_2 = Map(nth, att, 2),
d_1 = Map(nth, def, 1),
d_2 = Map(nth, def, 2)
) %>%
select(-a1, -a2, -d1, -d2, -att, -def) %>% # needed before unnest()
unnest() %>% # needed because the result of Map appears to still be a
mutate(
def_lose = as.numeric((a_1 > d_1) + (a_2 > d_2)), # number of defenders lost
att_lose = as.numeric((a_1 <= d_1) + (a_2 <= d_2)) # number of attackers lost
) %>%
count(def_lose, att_lose) %>%
mutate(att = 2, def = 2)Warning: `cols` is now required when using unnest().
Please use `cols = c(a_1, a_2, d_1, d_2)`probs <- probs %>% bind_rows(df)
##### 2 attackers / 1 defender #####
df <- list(a1, a2, d1) %>%
reduce(inner_join, by = "dummy") %>% # cartesian product of all individual die rolls to dataframe
select(-dummy) %>%
mutate(
# generate att / def list columns of sorted vector of rolls
att = Map(c, a1, a2),
att = Map(sort, att, decreasing = TRUE),
def = Map(c, d1),
def = Map(sort, def, decreasing = TRUE),
# generate columns of highest att / def rolls
a_1 = Map(nth, att, 1),
d_1 = Map(nth, def, 1)
) %>%
select(-a1, -a2, -d1, -att, -def) %>% # needed before unnest()
unnest() %>% # needed because the result of Map appears to still be a
mutate(
def_lose = as.numeric((a_1 > d_1) ), # number of defenders lost
att_lose = as.numeric((a_1 <= d_1) ) # number of attackers lost
) %>%
count(def_lose, att_lose) %>%
mutate(att = 2, def = 1)Warning: `cols` is now required when using unnest().
Please use `cols = c(a_1, d_1)`probs <- probs %>% bind_rows(df)
##### 1 attacker / 2 defenders #####
df <- list(a1, d1, d2) %>%
reduce(inner_join, by = "dummy") %>% # cartesian product of all individual die rolls to dataframe
select(-dummy) %>%
mutate(
# generate att / def list columns of sorted vector of rolls
att = Map(c, a1),
att = Map(sort, att, decreasing = TRUE),
def = Map(c, d1, d2),
def = Map(sort, def, decreasing = TRUE),
# generate columns of highest att / def rolls
a_1 = Map(nth, att, 1),
d_1 = Map(nth, def, 1)
) %>%
select(-a1, -d1, -d2, -att, -def) %>% # needed before unnest()
unnest() %>% # needed because the result of Map appears to still be a
mutate(
def_lose = as.numeric((a_1 > d_1) ), # number of defenders lost
att_lose = as.numeric((a_1 <= d_1) ) # number of attackers lost
) %>%
count(def_lose, att_lose) %>%
mutate(att = 1, def = 2)Warning: `cols` is now required when using unnest().
Please use `cols = c(a_1, d_1)`probs <- probs %>% bind_rows(df)
##### 1 attacker / 1 defender #####
df <- list(a1, d1) %>%
reduce(inner_join, by = "dummy") %>% # cartesian product of all individual die rolls to dataframe
select(-dummy) %>%
mutate(
# generate att / def list columns of sorted vector of rolls
att = Map(c, a1),
att = Map(sort, att, decreasing = TRUE),
def = Map(c, d1),
def = Map(sort, def, decreasing = TRUE),
# generate columns of highest att / def rolls
a_1 = Map(nth, att, 1),
d_1 = Map(nth, def, 1)
) %>%
select(-a1, -d1, -att, -def) %>% # needed before unnest()
unnest() %>% # needed because the result of Map appears to still be a
mutate(
def_lose = as.numeric((a_1 > d_1) ), # number of defenders lost
att_lose = as.numeric((a_1 <= d_1) ) # number of attackers lost
) %>%
count(def_lose, att_lose) %>%
mutate(att = 1, def = 1)Warning: `cols` is now required when using unnest().
Please use `cols = c(a_1, d_1)`probs <- probs %>% bind_rows(df)
probs <- probs %>%
group_by(att, def) %>%
mutate(p = n / sum(n)) %>%
ungroup()
probs # will use sample_n with weights p and replace = TRUE to simulate multiple turns# A tibble: 14 × 6
att def def_lose att_lose n p
<dbl> <dbl> <dbl> <dbl> <dbl> <dbl>
1 3 2 0 2 2275 0.293
2 3 2 1 1 2611 0.336
3 3 2 2 0 2890 0.372
4 3 1 0 1 441 0.340
5 3 1 1 0 855 0.660
6 2 2 0 2 581 0.448
7 2 2 1 1 420 0.324
8 2 2 2 0 295 0.228
9 2 1 0 1 91 0.421
10 2 1 1 0 125 0.579
11 1 2 0 1 161 0.745
12 1 2 1 0 55 0.255
13 1 1 0 1 21 0.583
14 1 1 1 0 15 0.417